GRIPS - long-term measurements at the mesopause near 87 km altitude
GRIPS: Long-term trends
The temperature in the mesopause region at about 87 km has been measured continuously from Wuppertal since the middle of 1987. Temperature time series of this length and in this altitude range are very rare. Therefore, the Wuppertal time series is of great importance for the investigation of the long-term development of the temperatures in this altitude range. All findings regarding the temperature development at various altitudes during the last decades are very important in view of the climate change and its consequences. Due to several possible long-term influences, the entire picture of the development can only be seen after many years of measurement. Only then ongoing long-term trends can be distinguished from other (long-term) variations. Because of the length of the time series, the Wuppertal temperatures can be used to analyze and distinguish these long-term variations.
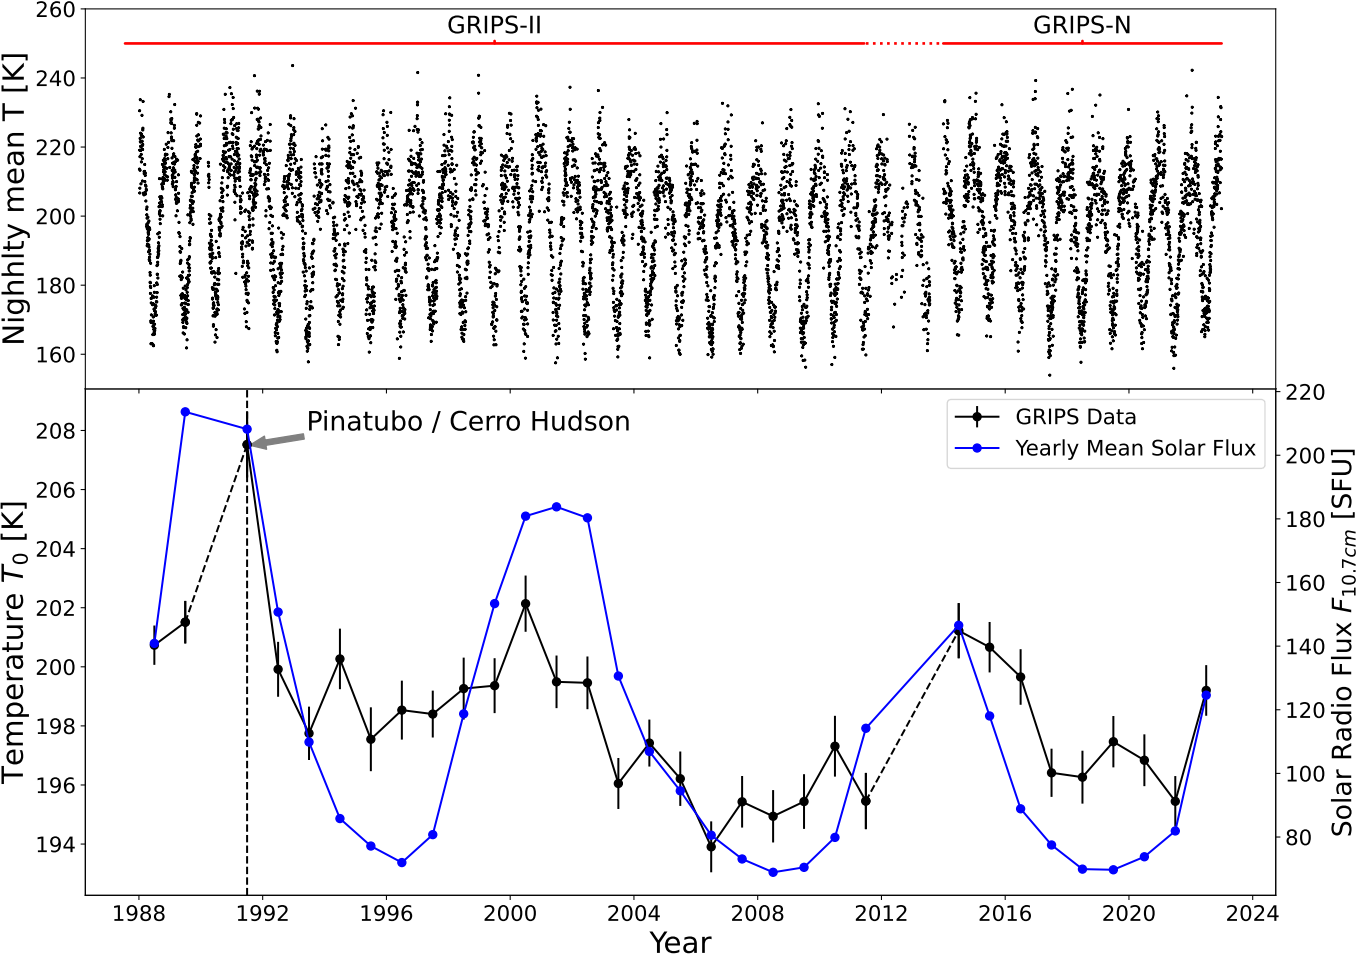
Figure 1: Nightly mean temperatures (upper panel) and yearly mean temperatures (black dots in lower panel) since 1988. The blue curve in the lower panel depicts the solar radio flux F10.7 cm. The figure is taken from Kalicinsky et al. (2023).
Read more about
The time series of nightly mean temperatures since 1988 are shown in Figure 1 (upper panel) together with the corresponding annual mean values (lower panel; the years 1991, 2012 and 2013 are missing due to large measurement gaps). The local maxima of the annual mean values occur at the same time as the maxima of the solar flux (compare blue curve in lower panel of Fig. 1). The solar flux is a measure of the solar activity and has an about 11-year cycle. The analysis showed a dependence of temperature to the 11-year cycle of solar activity of about 4 - 5 K/(100 solar flux units). This value is an additional confirmation of the relationship between the temperature and the solar activity, which has already been confirmed by many other measurements with similar values.
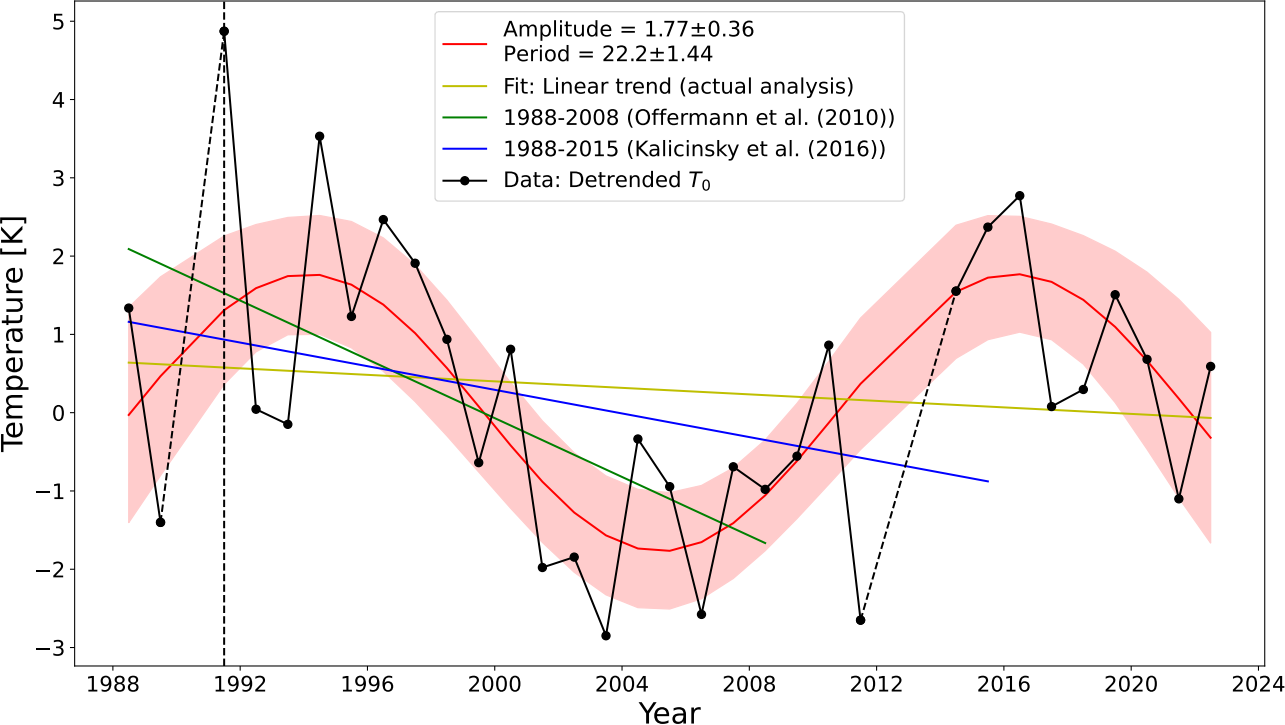
Figure 2: Yearly mean temperatures after subtracting the solar influence. The red curve shows the 22-year oscillation with its uncertainty range. The colored straight lines show linear trends in different time intervals. The figure is taken from Kalicinsky et al. (2023).
Read more about
In addition to the well-known solar influence, the temperature time series shows an oscillation with a period of about 22 years and an amplitude of about 1.8 K (see Figure 2 red curve). These two long-term variations are enough to describe the long-term development of the temperature time series. Thus, no long-term trend, as often seen by other measurements, is necessary for the description. This new insights were gained through a re-examination of the data series with measurements up to and including 2015 for the first time (Kalicinsky et al. (2016)). In the last analysis of the time series, which then includes the measurements until the end of 2022, the long-term oscillation becomes even more obvious and the period and amplitude could be derived with much lower uncertainties (compare Fig. 2). In the study before these two mentioned ones, which was performed for the time interval 1988-2008, a negative long-term trend of about 2 K/decade was determined in additon to the solar influence. However, this strong mean decrease in temperature is in line with the 22-year oscillation. As the analysis was performed for a time interval, in which mainly a temperature decrease occurred, the second long-term variation that was observed in addition to the solar influence was a nearly linear temperature decrease (see green trend line in Fig. 2). Due to the 22-year oscillation, different long-term trends are visible depending on the analyzed time interval. A significantly weaker mean temperature decrease of less than 1 K/decade was determined for the period 1988 - 2015 (blue trend line in Figure 2), which is mainly caused to the increase in temperature after 2005/06. An even smaller temperature decrease is observed when the complete time interval is analyzed (see yellow trend line in Fig. 2). The whole picture of the development and the different possible trends became recognizable only after many years of measurement. This additionally underlines the importance of long-term measurements for the analysis of such long-term variations.
Further information on long-term development can be found in Kalicinsky et al. (2016), (2018) and (2023).